 |
Structural Bioinformatics Library
Template C++ / Python API for developping structural bioinformatics applications.
|
 |
Structural Bioinformatics Library
Template C++ / Python API for developping structural bioinformatics applications.
|
Authors: F. Cazals and T. Dreyfus
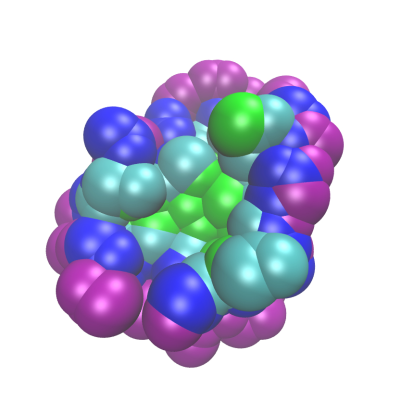
 |  |
|
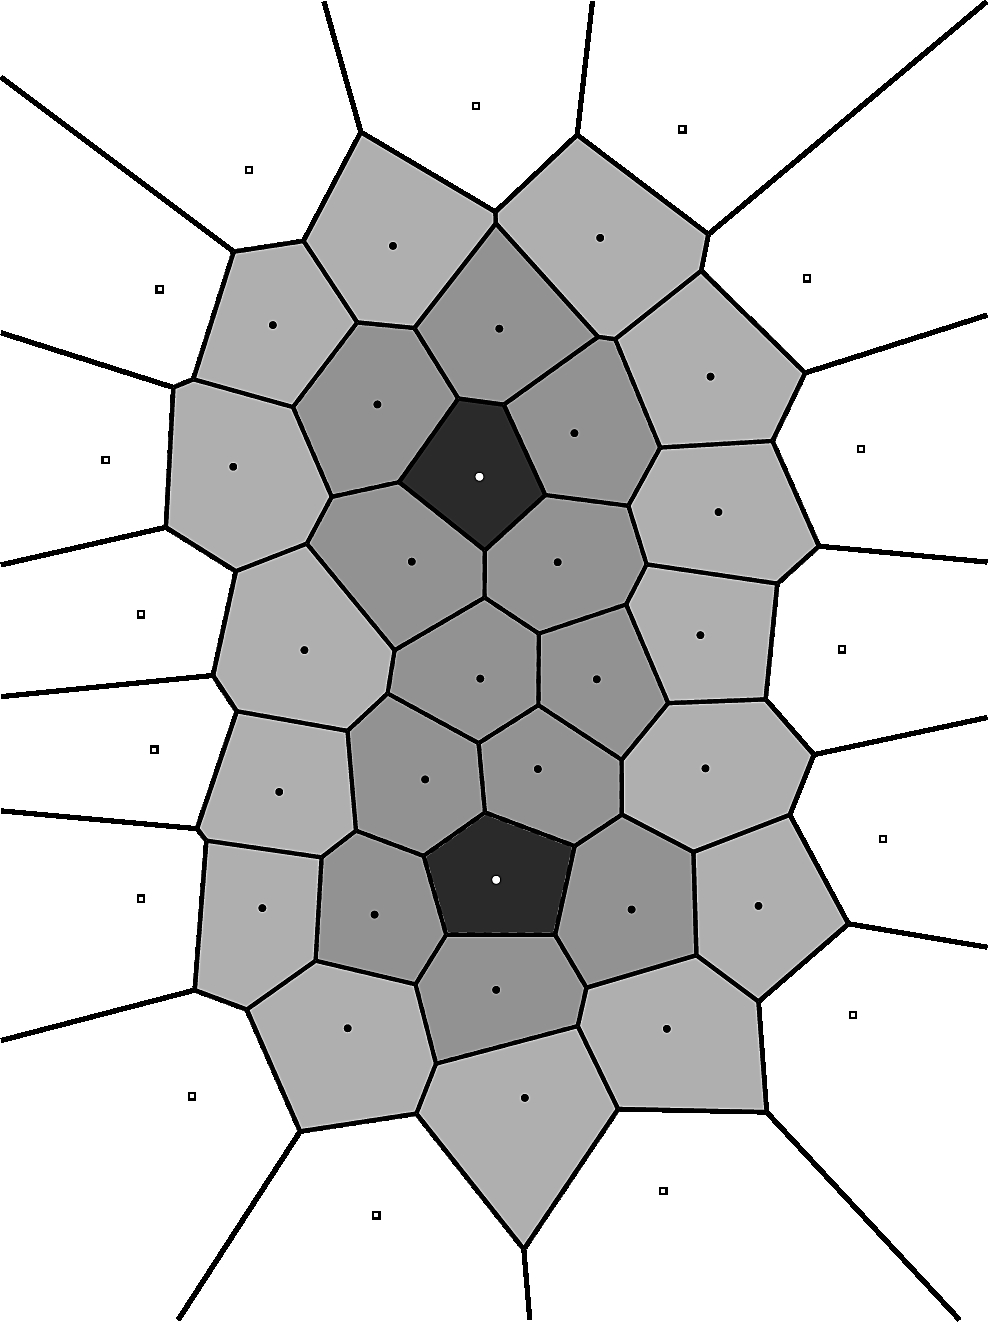
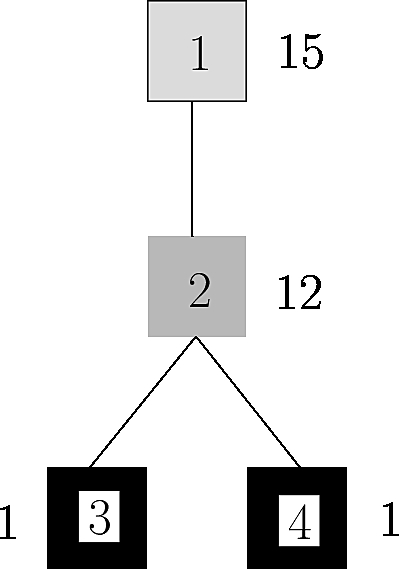
Shelling a cell complex A Voronoi diagram is an example cell complex, whose cells are the Voronoi cells, two cells being connected by a Voronoi edge. We aim at shelling the cells, by assigning them a number from the outside to the core. Here the background cells are in white, and those being shelled in grey. These latter shells are partitioned in four shells, respectively at distance 1, 2, and 3 from the background. Note that the cells at distance three consist of two connected components. The relative position of the shells is encoded in a tree called a shelling tree. | |
|---|---|
Consider a binary complex involving two partners, represented with their solvent accessible models. Given these partners, which typically correspond to a receptor and a ligand, a binding patch or patch for short is the collection of atoms of a given partner that account for key features of the interaction with the second partner. Such atoms can be defined in a number of ways (using a distance threshold or the loss of solvent accessibility in the complex), but Space_filling_model_shelling_diagram_surface_encoding, similarly to Space_filling_model_interface, uses a Voronoi based characterization, as argued in [54] .
The patches contributed by the partners can be used to define the interface, as also explained in Space_filling_model_interface. However, in the sequel, the focus is on the patches, as illustrated below:
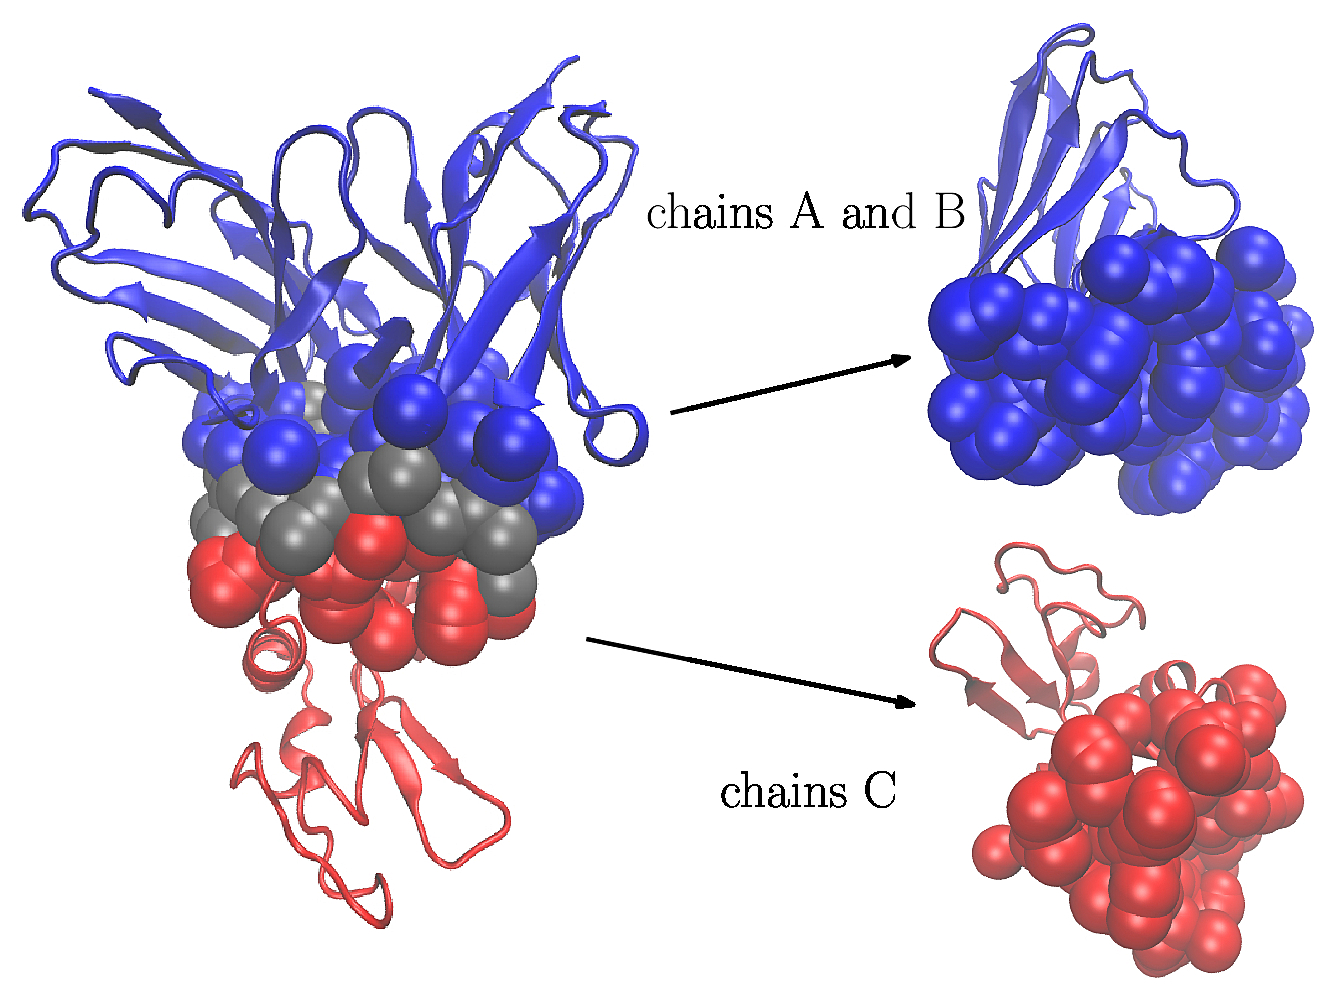 |
Binding patches of a protein complex. A protein - protein complex involving an antibody (PDB 1vfb, chains A and B in blue) and an antigen (chain C in red). (Left) The two partners with the atoms at the interface represented with the solvent accessible (SAS) model. The interfacial water molecules are represented in gray. (Right) The interface atoms of each partner define its binding patch. |
Once a patch has been defined, a classical dissection consists of segregating its atoms into a core and a rim.
As we shall see in section Pre-requisites, Space_filling_model_shelling_diagram_surface_encoding goes beyond the core-rim model by assigning an integer value to each atom, and by grouping such atoms into shells. In a nutshell, the process is as follows:


The encoding just defined can be used for a number of structural studies, as detailed in [140] and the references cited therein:
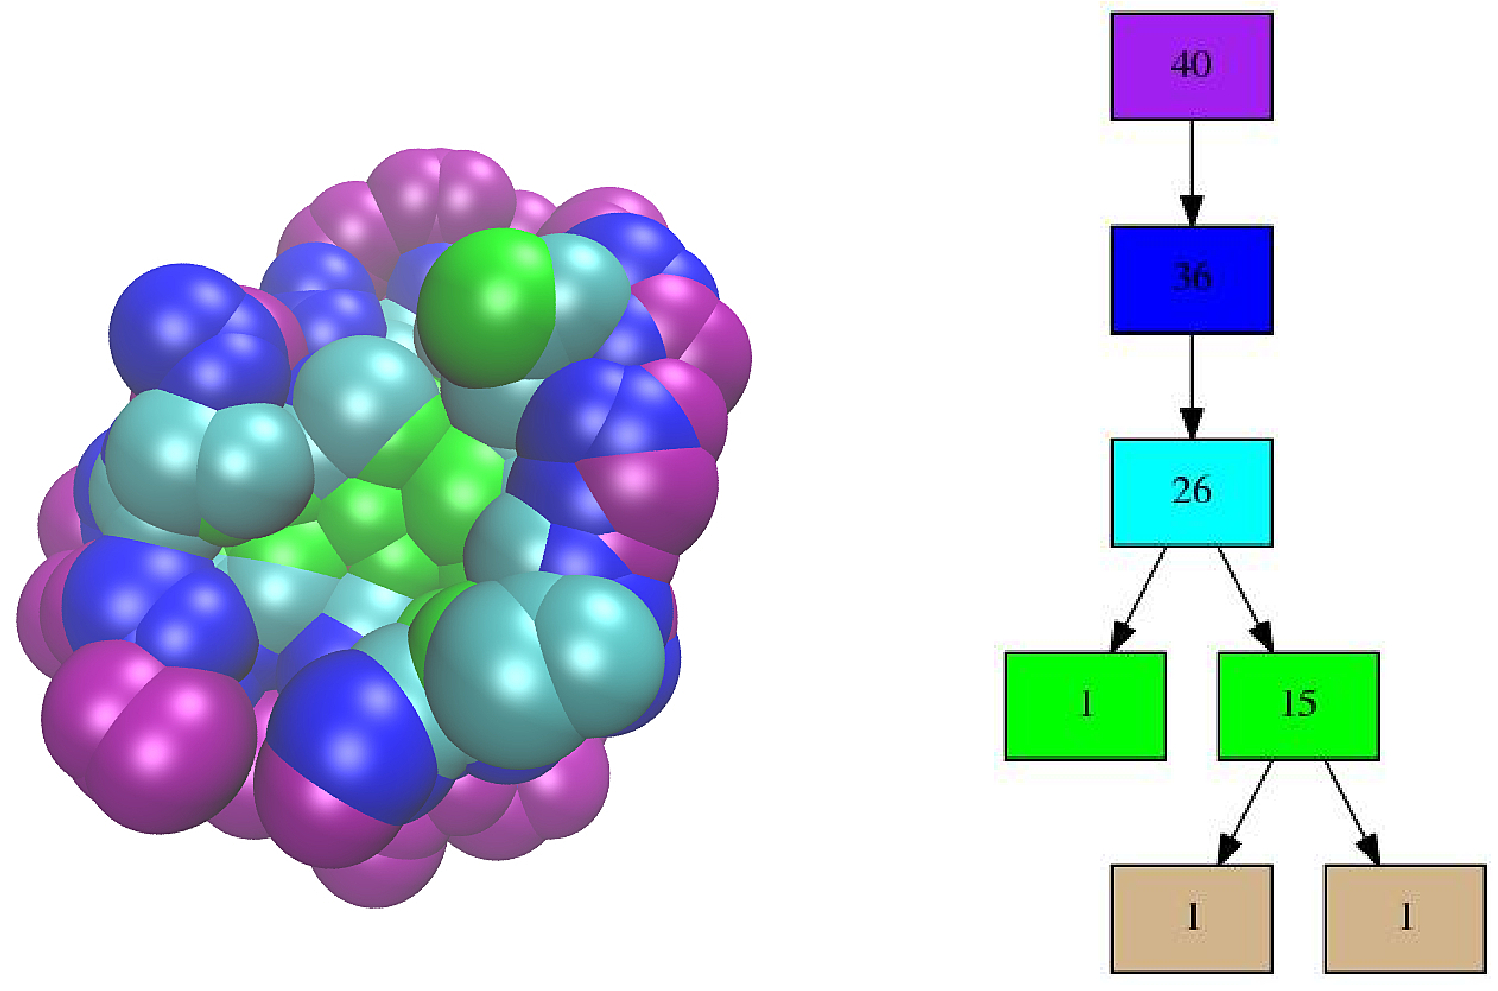 |
The shelling tree of the binding patch of the IG in the complex of Fig. fig-1vfb-binding-patches. The binding patch is partitioned into 6 shells: for example, the first one (white atoms), which may be called the rim of the binding patch, consists of 36 atoms located at distance one from the background atoms (grey-blue atoms); the two innermost shells, which are located at distance five from the background, respectively consist of one and two atoms. |
This section presents the program 
Let 


Having identified the interface atoms, we process the two subunits separately, and define:
A binding patch is a so-called cell complex (Fig. Spherical cell complex) consisting of cells of dimension 0, 1 and 2, respectively: the 0 cells or vertices are points found at the intersection of three spheres; the 1 cells are circle arcs found on the intersection circle of two spheres; the 2 cells or faces are spherical polygons contributed by the atoms. This cell complex is encoded in a so-called Half-edge Data Structure (HDS), that gives access to the incidences between all cells. See the CGAL documentation.
Note that the boundary of a connected component of a binding patch consists of one or more curves made of circle arcs, called connected component of the boundary (CCB) .
Note also that the faces and the circles arcs admit a dual graph, with one vertex per face, and one edge per circle arc. This graph can be used to visit the patch, as we shall see soon.
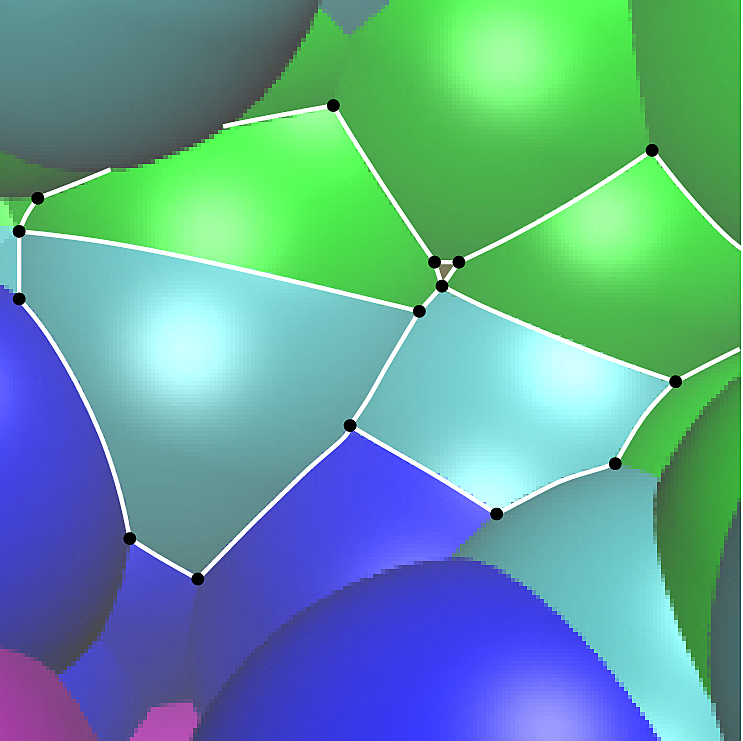 |
The cell complex defined by the half-edge data structure encoding the boundary of a union of balls. The cell complex consists of 2-cells (spherical polygons), 1-cells (circle arcs), and 0-cells (points at the intersection of three spheres). |
Shelling consists of assigning an integer value called shelling order or SO to each face (i.e. 2-cell or spherical polygon), and is best presented in terms of graph distance.
More precisely, consider the dual graph of the patch: the nodes of this graph are the faces; two nodes are connected by an edge provided that the associated faces share a circle-arc.
Note that the contribution of an atom to the patch may consist of several faces with different SO.
By convention, the background faces have a SO = 0, so that the SO is a non negative integer, typically in the range 1..10.
The SO and the dual graph are used to compute a following topological encoding, based on shells :
Shells define a partition of the patch, and their relative position is used to define a tree:


In order to base the comparison of patches on atoms rather than faces, we edit the face shelling tree into an atom shelling tree. The process consists of substituting atoms to faces, with the following special cases:
Finally, the sons of a node are sorted by increasing size, i.e. number of atoms, resulting in an ordered atom shelling tree, called shelling tree for short in the sequel.
Note that the atom shelling tree encodes topological information, namely the relative position of the shells, while the 3D coordinates of the atoms within the shells encode the geometry.
Given the 3D structure of a complex (a .pdb file), and the two sets of chain IDs of the considered partners, 

> sbl-vorshell-bp-ABW-atomic.exe -f data/1vfb.pdb -P AB -P C --directory results --verbose --output-prefix --log --is-tree --patch-viewer vmd
Note that a default radius of 
| File Name | Description |
| 1vfb pdb file | Immunoglobulin-antigen complex |
Three categories of output files are created from the last command line:
During its execution, a record on the main steps undertaken is dumped into the called window. This information can be sent stored a log file with the option -l .
| Preview | File Name | Description |
| General: log file | ||
| Log file | Log file containing high level information on the run of | |
| Module shelling of patch at interface: patches, face shelling trees and atom shelling trees | ||
| A Atom Shelling Forest xml file | XML file describing the Atom Shelling Forest of binding patches of partner A | |
 | A Atom Shelling Forest dot file | dot file to be used with Graphviz for visualizing the Atom Shelling Forest of binding patches of partner A |
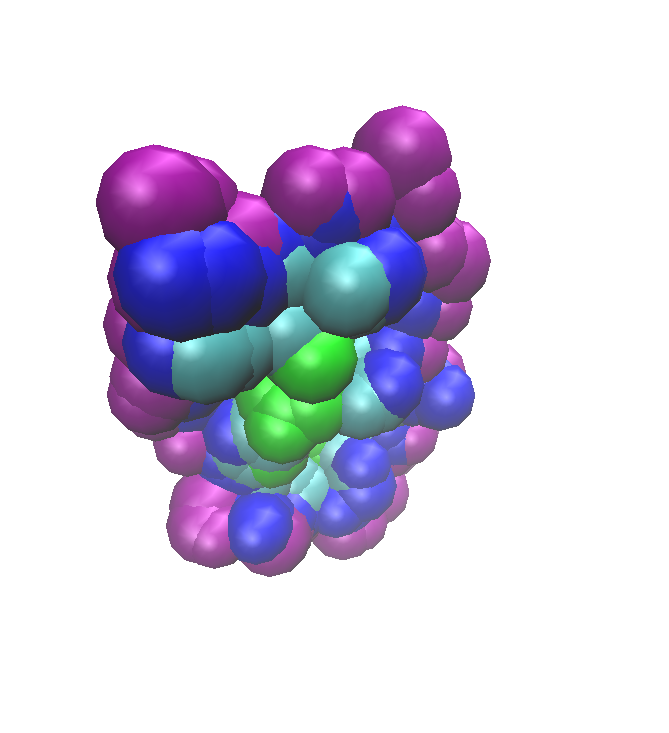 | A Binding Patches VMD file | Visualization state file of the binding patches of partner A colored by shelling orders |
| B Atom Shelling Forest xml file | XML file describing the Atom Shelling Forest of binding patches of partner B | |
 | B Atom Shelling Forest dot file | dot file to be used with Graphviz for visualizing the Atom Shelling Forest of binding patches of partner B |
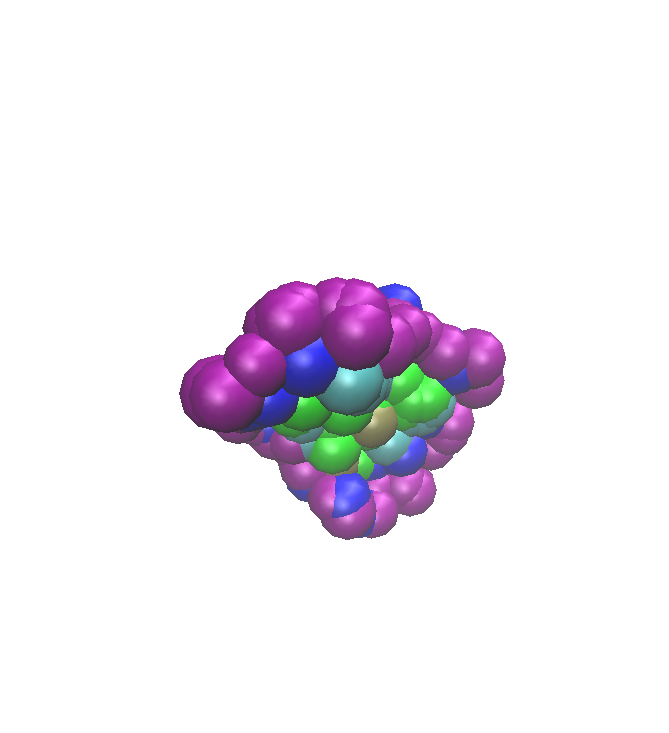 | B Binding Patches VMD file | Visualization state file of the binding patches of partner B colored by shelling orders |
For visualizing the shelling forests, we recommend you to install Graphviz (see the Graphviz web site), and using the dot software for drawing the graph from a .dot file. Note that there are other software from the Graphviz library for drawing the graphs with different embedding.
For visualizing the particles with their shelling orders, we recommend you to install VMD (see the VMD web site): first load the input PDB file, then load the output visualization state files. The loading of visualization state files may be long, but is a lot faster using the fastload VMD script delivered with the library (in the scripts/vmd directory).
The SBL provides VMD and PyMOL plugins to use the programs of Space_filling_model_shelling_diagram_surface_encoding . The plugins are accessible in the Extensions menu of VMD or in the Plugin menu of PyMOL . Upon termination of a calculation launched by the plugin, the following visualizations are available:
The programs of Space_filling_model_shelling_diagram_surface_encoding described above are based upon generic C++ classes, so that additional versions can easily be developed.
In order to derive such versions, there are two important ingredients, that are the workflow class, and its traits class.
T_Space_filling_model_shelling_diagram_surface_encoding_traits:
T_Space_filling_model_shelling_diagram_surface_encoding_workflow: