Template C++ / Python API for developping structural bioinformatics applications.
User Manual
Tertiary_quaternary_structure_annotator
Authors:F. Cazals and and T. Dreyfus and R. Tetley
Introduction
This package provides annotations of tertiary and quaternary structures.
In a nutshell:
Consider a structure (molecule, complex) decomposed into units. A unit may be a polypeptide chain, a domain, a set of residues, etc.
We seek interactions between these units, which may be: covalent bonds (disulfide bonds), salt bridges, etc.
Pre-requisites
A decomposition for a polypeptide chain is a set of intervals such that (i) each interval specifies a set of consecutive a.a., and (ii) any two intervals are disjoint. Additionally, if the union of intervals does not cover the whole a.a. sequence of a polypeptide chain, a gap refers to the set of a.a. squeezed in-between two consecutive intervals.
Two comments are in order:
Practically, one label is attached to each unit of the decomposition, as specified from the package MolecularSystemLabelsTraits.
Gaps are of special interest when a region of a molecule could not be reconstructed–e.g. a flexible loop in a crystal structure.
A unit in a structure refers either to (i) a polypeptide chain, an interval in a decomposition, or a gap in a decomposition.
We are interested in building graphs connecting units. Edges between units encode, in particular, features of biochemical interest:
Vertices. A vertex corresponds to one unit. There are 2 cases:
A vertex represents a polypeptide chain or an interval in a decomposition.
A vertex represents a gap in a decomposition if an annotation (salt-bridge, disulfide bond) involves the amino acids defined by this gap.
In addition, each vertex is decorated with two numbers , with the number of residues found in the structure, and the number of residues specifying the interval.
Edges coding the primary sequence. Two units which are consecutive along the sequence are linked by a dashed line. In addition, if the two units are separated by a gap, the corresponding interval (in terms of residue ids) is displayed with the edge. (Corollary: a dashed edge with no interval connects two units linked by a peptide bond.)
Edges coding biophysical features.
The following edges, represented by bold lines, are sought between two units:
edge S-B: edge counting the number of only salt-bridges between the two units. See the package Pointwise_interactions .
edge S-S: edge counting the number of disulfide bonds between the two units. See the package Pointwise_interactions .
A particular case is that of a disulfide bond or salt-bridge involving a region corresponding to a gap (see Definition above), yet present in the structure. Since by definition, such a region does not have a label, we proceed as follows:
a new label is created by concatenating those of the units before and after, and a node is created.
node is linked to those before and after by dashed lines (indicating the sequentiality along the sequence).
node is endowed with edges reporting the S-S and/or S-B. Note that these edges may be loops if the disulfide bond or salt bridge is internal to the region.
Illustration. As a simple illustration where the units are polypeptide chains, package Space_filling_model_interface_finder provides an example of an antibody whose disulfide bonds are sought.
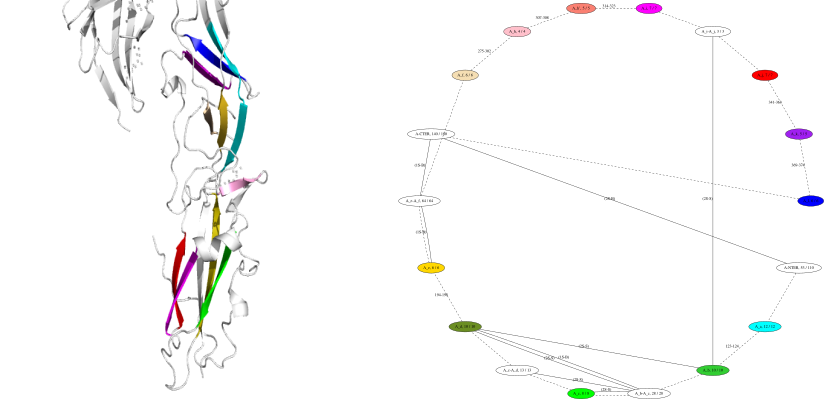
Illustration. Fig. TQ_structure_annotator_graph illustrates the annotation functionalities for the so-called domain II of a class II fusion protein [160] .
Note that the nodes of the graph correspond on the structure to beta sheets and the loops connecting them. The solid lines illustrate salt bridges and disulfide bonds between these elements.
Annotating the domain II of a class II fusion protein–structure and graph
The specification file used for representing the domain is :
domains-template-begin EFF1
a 111-122
b 125-134
c 163-170
d 184-193
cd 171-183
e 199-204
f 269-274
h 303-306
h’ 309-313
i 324-330
j 334-340
k 364-368
l 375-380
end
chains-enumeration-begin
A like EFF1
BC
end
The Graphviz command used for generating the graph is :
dot -Tsvg interface.dot -o interfaces.svg
Algorithms
Annotating a structure requires finding salt bridges and disulfides bonds, see the package Pointwise_interactions .
For visualizing the graph, the static method SBL::CSB::T_Tertiary_quaternary_structure_annotator::print dumps the graph into a .dot file, a file format used by the Graphviz software. The following command allows to generate a pdf image file representing an output graph :
The following examples show how to use the class T_Tertiary_quaternary_structure_annotator in different contexts : when looking at interfaces between polypeptidic chains or between domains.
Interfaces between chains
The following example loads an input PDB file and prints a Graphviz file representing the interfaces graph between the polypeptidic chains. A Graphviz file can be processed using the dot software to produce an image of the graph.
The following example loads an input PDB file and prints a Graphviz file representing the interfaces graph between the domains defined in an input specification file. A Graphviz file can be processed using the dot software to produce an image of the graph.